|
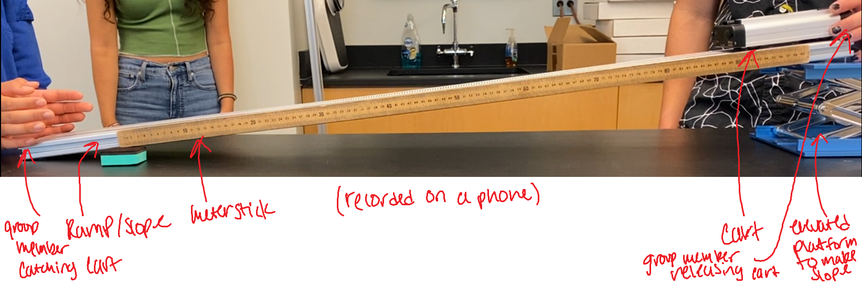
Group Members: Michael Palumbo, Priyanka Nanayakkara Question: How does time affect the position of a cart on a ramp? Variables:
 Graphs:
Conclusion:
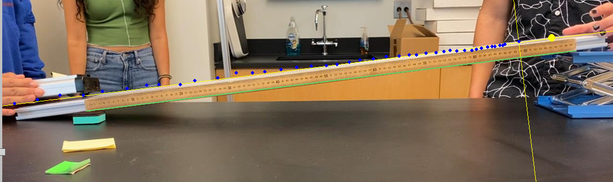
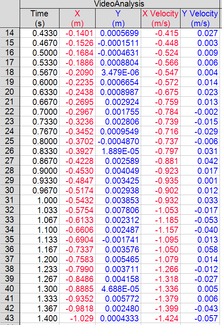
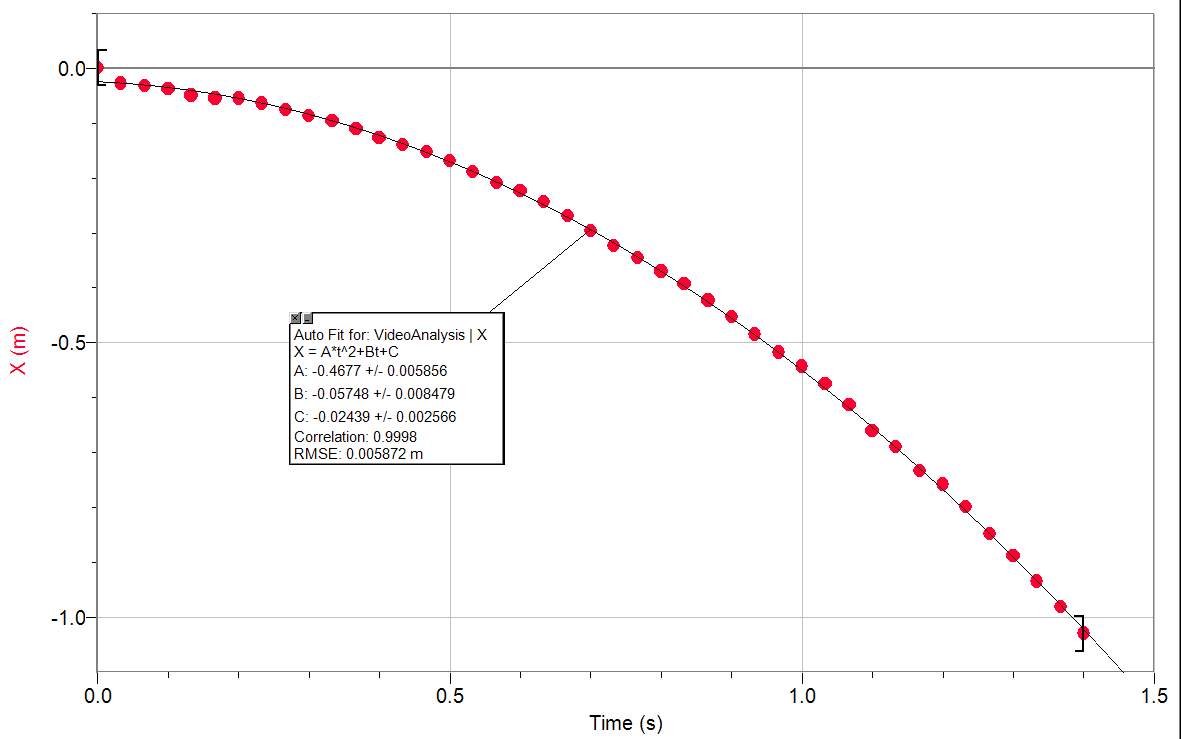
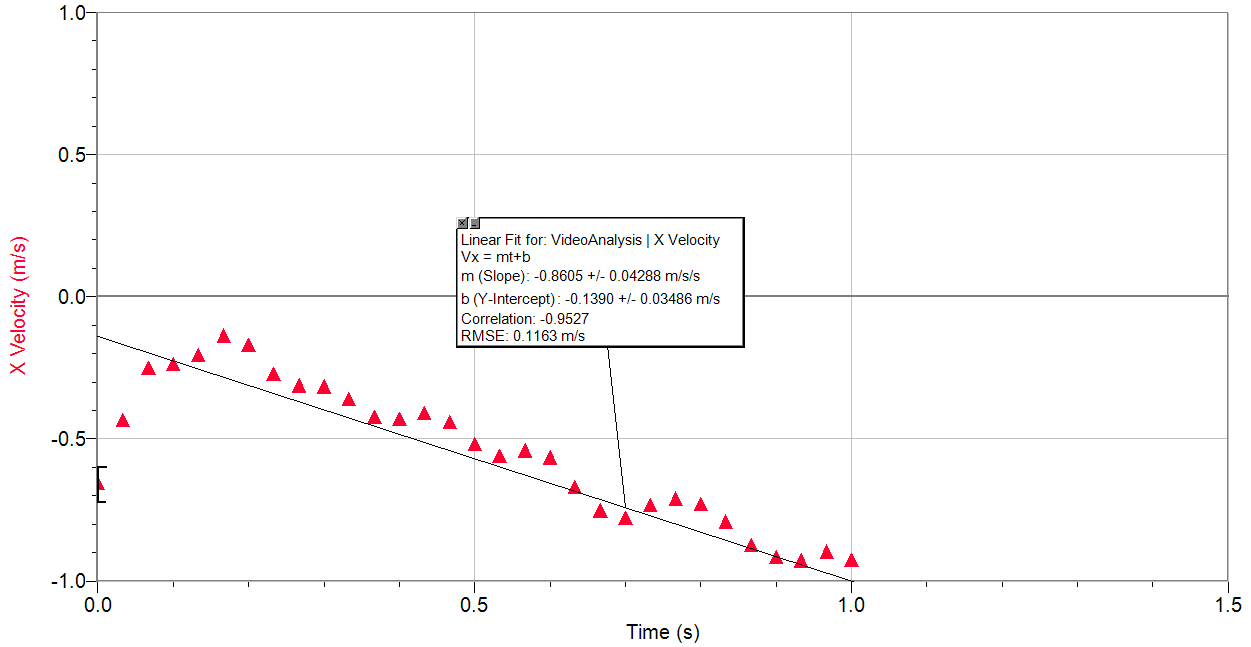
In this lab, we examined the effect of time on a cart moving down a slope. For this experiment, we did only one trial. However, we still had constants that are pertinent to our results, which are the steepness of the ramp and the cart used. To actually collect the data from our trial, we took a video. Unlike the human eye, and simply the difficulty of getting so many points on the ramp by hand, a video moves frame by frame, which allowed us to get a lot of more accurate data points. Our data points show a quadratic curve on a position-time graph. This means that the cart was accelerating at a constant speed-- acceleration is change in velocity over time (m/s/s). As the cart travels down the ramp, its change in position increasingly moves farther away from the origin over time. In the velocity-time graph, the negative slope can be seen. While the data points are not perfectly linear, its general slope is clear. This graph shows that the velocity changes at a constant rate over time. Looking at the two graphs, we can see the connection between change in position, change in velocity, and change in time. A constant slope in the velocity-time graph will cause the position to keep changing at a greater interval as time goes on. Weaknesses/Uncertainties: A weakness leading to uncertainties in our data are the method for data collection on logger pro. Although the video is indeed accurate, because it is in real time, the fact that the data points were collected by hand, by us clicking at certain points where the cart was, might lead to some uncertainty. Since the data was collected on video, multiple trials would not have been necessary. Moreover, these points would still be more accurate than if we were to have done the experiment without the video, but because of our reaction time and not-perfect computer skills, the points collected on Logger pro may not be perfectly accurate. Improvement: One thing I would do to improve this lab is the data collecting method. While using the video and an advanced computer software was a lot more accurate than collecting points in real time, the quality of the video in Logger pro probably caused some uncertainty in the points I chose for my graph. For this reason, the graphs may not be perfectly accurate. Thus, if there was some sort of application that could be programmed to find the data points without humans, the results to this experiment could be a lot more accurate.
0 Comments
|
Archives
December 2021
Categories |
 RSS Feed
