Key Terms:
Position: Location at a specific time (x)
Distance: How location changes over the course of a trip, independent of direction (d) *scalar
Displacement: Change in position overall on a trip (xfinal-xinitial), with direction (Δx) *vector
Position: Location at a specific time (x)
Distance: How location changes over the course of a trip, independent of direction (d) *scalar
Displacement: Change in position overall on a trip (xfinal-xinitial), with direction (Δx) *vector
Interpreting Position Time Graphs:
|
Vertical Axis: Position(x)
Horizontal Axis: Time(s) Position-Time graphs are a visual representation of how the position of an object changes over the course of time. From the Cart on a Ramp graph, we can observe that the cart's position changed at an increasing interval, not a constant interval. Thus, the graph for the line of best fit was quadratic, not linear. Determining velocity and speed: The slope of a position time graph indicates the velocity: The steepness/magnitude of the slope indicates speed The sign of the slope (+/-) indicates direction |
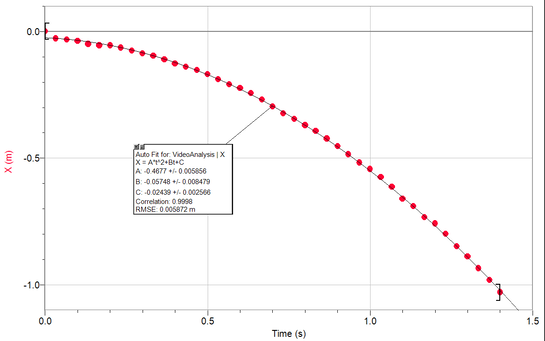
Position-time graph of Cart on Ramp
|
Interpreting Velocity Time Graphs:
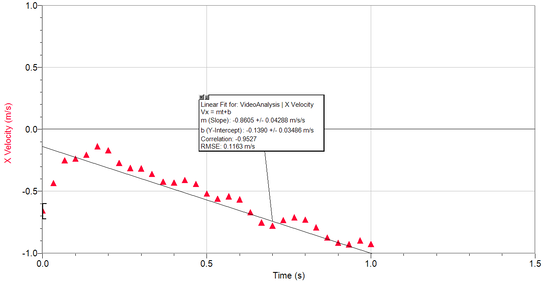
Velocity-Time Graph of Cart on Ramp
|
Vertical Axis: Velocity (m/s)
Horizontal Axis: Time (s) Velocity-time graphs are a visual representation of the change in velocity over time. In relation to position time graphs, if a velocity time graph is a flat line, the position changes at a linear rate. If a velocity time graph has a constant slope (like this one), the position time graph will depict a quadratic curve (like the one above this). Determining acceleration and starting velocity from a Position Time Graph: Y-intercept: starting velocity Slope: change in velocity over time, or the acceleration Determining Position, Distance and Displacement from a Velocity Time Graph: Position: initial position + area under the graph Distance: absolute value of the area under the graph Displacement: actual value of the area under the graph (with signs) |
Connecting representations of motion--
x-t graphs, v-t graphs, strobe diagrams:
(Using Projectile Motion--A ball free falling)
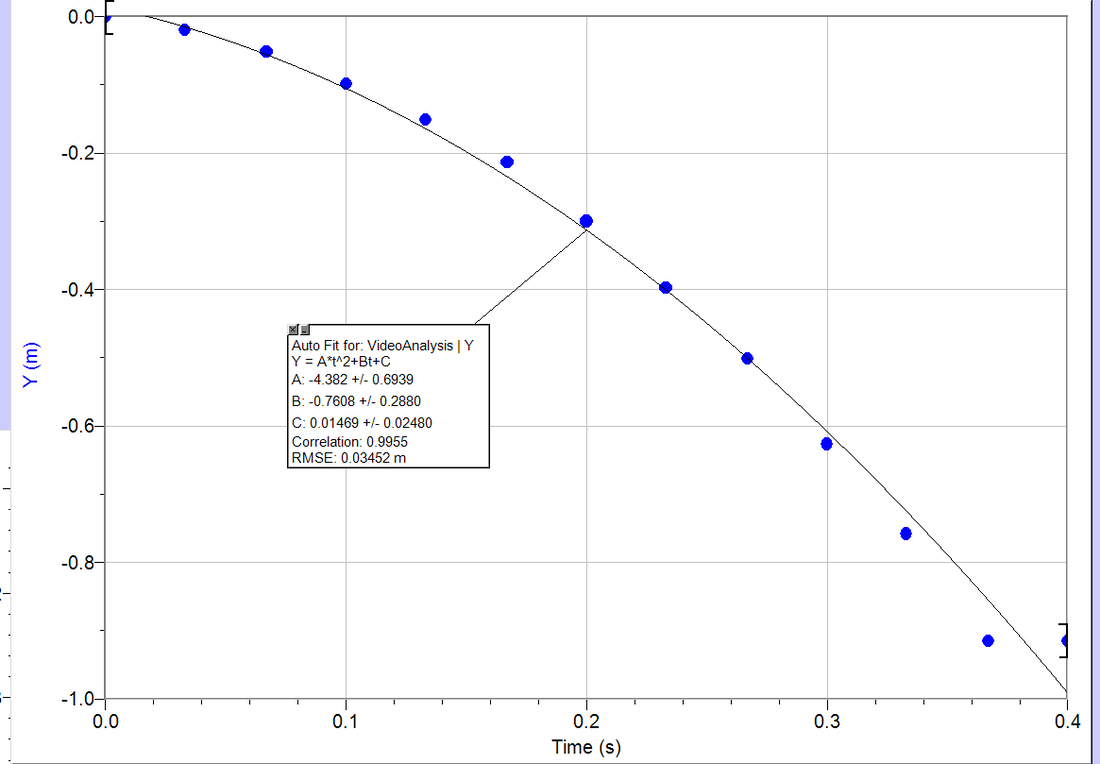
Position-Time Graph
|
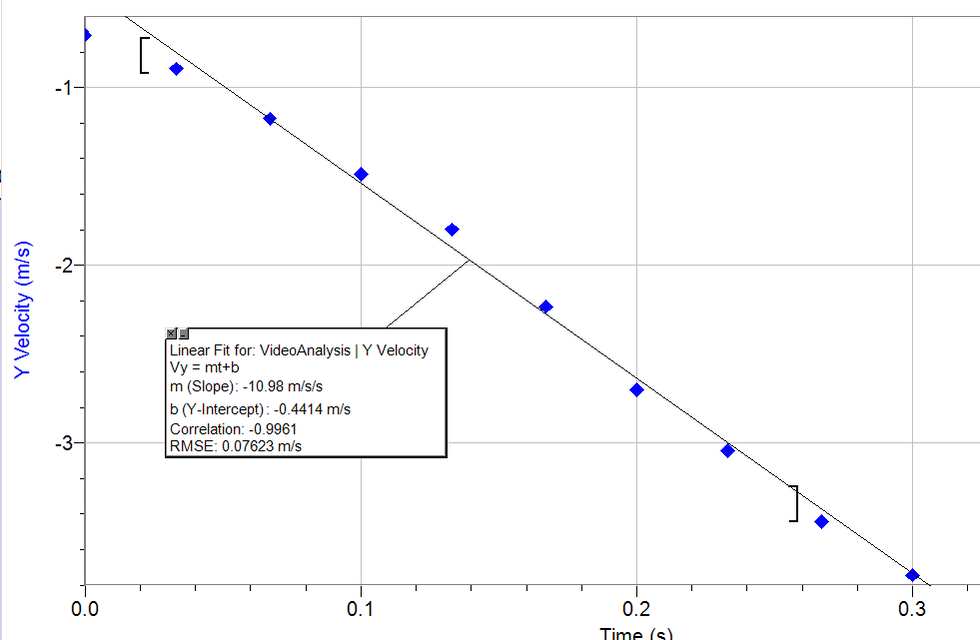
Velocity-Time Graph
|
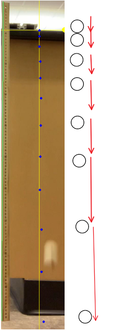
Strobe diagram
|
From the two graphs, the connection between position and velocity is clear. When position is changing at an increasing rate, the velocity is changing one degree slower (quadratic vs. linear). This specific strobe diagram shows the vertical component of the ball free falling. As time goes on, the velocity increases at a constant acceleration. Because it is a projectile (an object moving in air without interacting with the air), this acceleration is -9.8m/s/s, or gravity. Projectiles' position changes at an increasing rate, because the acceleration is constant, meaning the velocity changes at a constant rate.
Solving Problems using constant velocity and uniform acceleration models:
Constant Velocity: velocity stays the same while the object is in motion. When the velocity is constant, acceleration is 0 m/s/s and position changes linearly.
Uniform Acceleration: velocity changes at a constant rate; the object has a constant acceleration. When acceleration is constant, velocity changes linearly, and position changes quadratically.
Uniform Acceleration: velocity changes at a constant rate; the object has a constant acceleration. When acceleration is constant, velocity changes linearly, and position changes quadratically.
