|
Group Members: Emmy Xu, Grace Chung Research Question: How does tangential speed affect acceleration of the bob in the air? Variables:
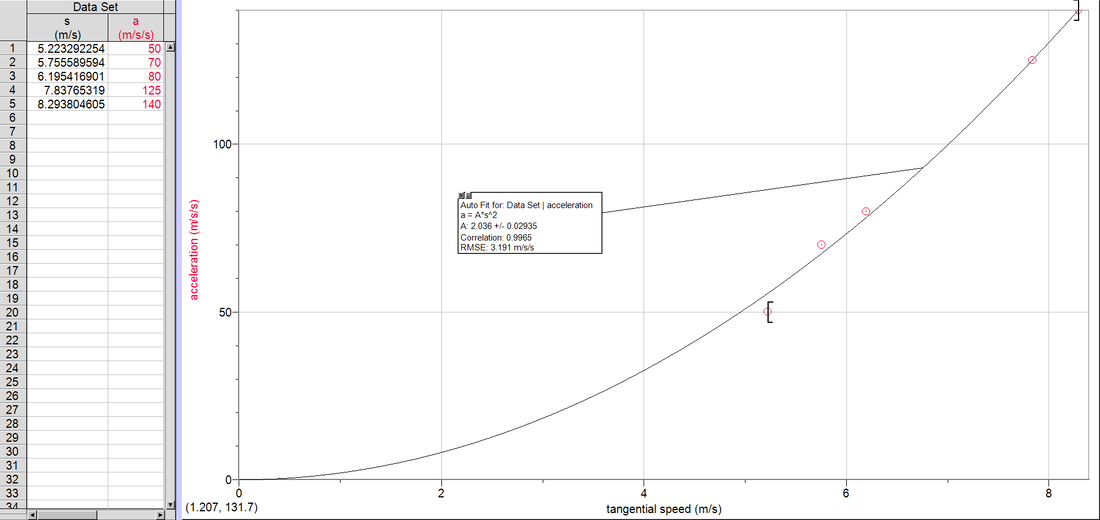
The Set-Up: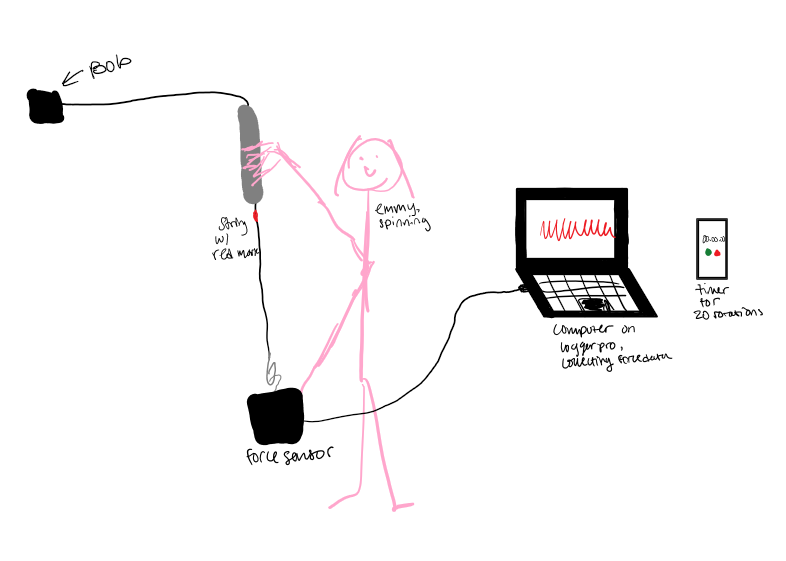 Data: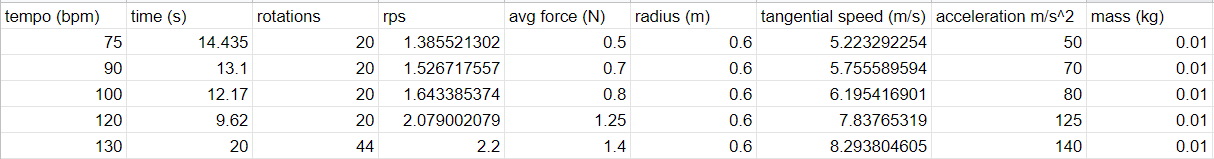 Raw Data 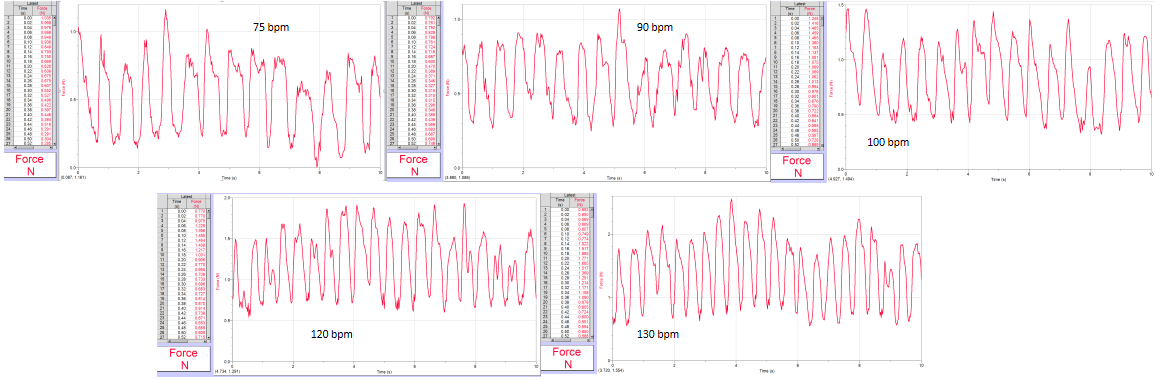 force sensor graphs Graph:
Conclusions:In this lab, we tested how the speed of a bob being swung in the air would affect the acceleration of it. For this experiment, we conducted one trial for each speed/tempo. In total, we collected 5 data points for our final graph. We used a metronome to control the pace at which the bob was swung around in a circle. For each trial, we slowed down the tempo to see how the rotational speed was connected to the acceleration, tangential speed, and also the net force of the tension between the string and the bob.
Originally, the graph of tangential speed v. acceleration was a linear fitted graph, seeing as it fit well in our interval of data. However, the linear fit lacked a y intercept of 0 and acceleration was not positive for negative speeds. These two aspects of the line of best fit are crucial to our conclusions and further assumptions of information because when the speed is 0, the object cannot be accelerating, thus making the acceleration 0 as well. Additionally, when speed is negative, this just means it was moving in the opposite direction/backwards; therefore, this does not equate to having a negative acceleration, as it would be accelerating at the same rate moving in the other direction. Finally, because our data points did not have a greater range, it does look linear on the interval we provided. Thus, we concluded that a simple quadratic function would be able to fit our data points as well as match other information and assumptions we know of, as stated above. Therefore, this graph shows that acceleration will always be positive, and that as tangential speed's magnitude increases, the acceleration increases with a quadratic relationship. Weaknesses/Uncertainties: One weakness or limitation in our data collection is the amount and range of our data points. Usually, it is optimal to include at least 10 data points, with the range being about 2 times greater than it is now. Therefore, the limited information led us to the issue of finding an accurate line of best fit, as explained above. However, using background knowledge, we were able to figure out that a simple quadratic would best suit the data as well as for making predictions. Improvements: An improvement to this experiment would be to have more data points and a greater range of points as well. As stated above, a crucial issue in finding a line of best fit was that the data we collected limited our ability to see further correlations that would make the graph not be linear. Moreover, there should maybe be a different method of collecting the angular speed, possibly taking videos rather than just going by eyesight in real time to count the rotations since the issue of reaction time can compromise the accuracy of the data.
0 Comments
|
Archives
December 2021
Categories |
 RSS Feed
