|
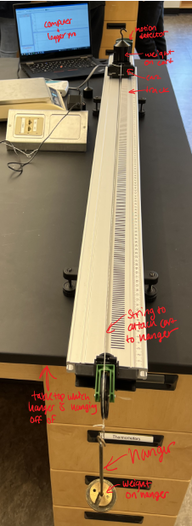
Group Members: Curtis Zhou, Sara Plunkett For Both Experiments:Controlling the Variables:
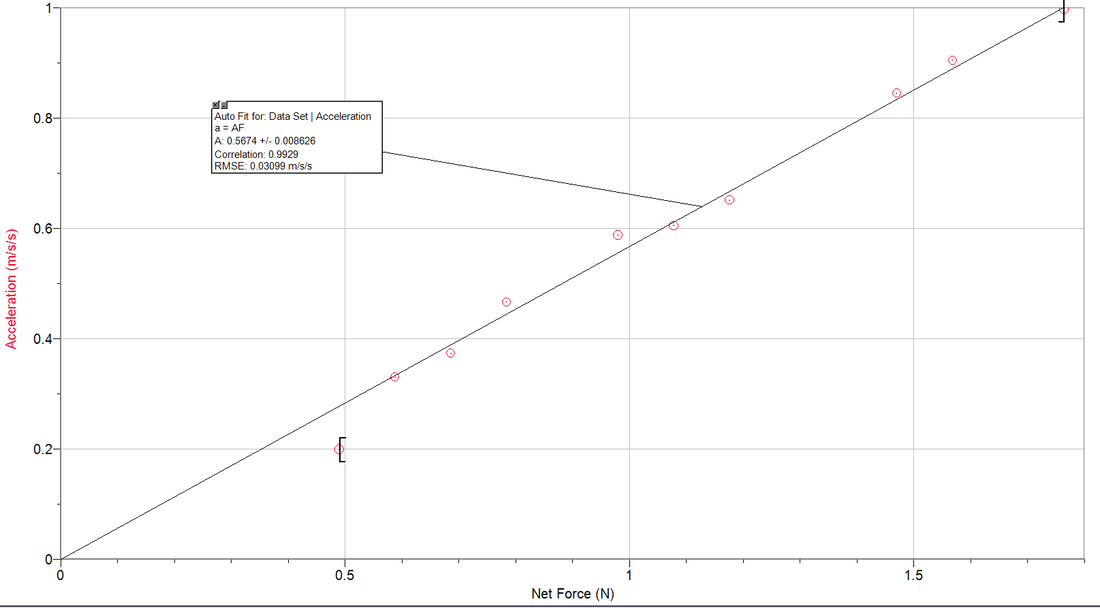
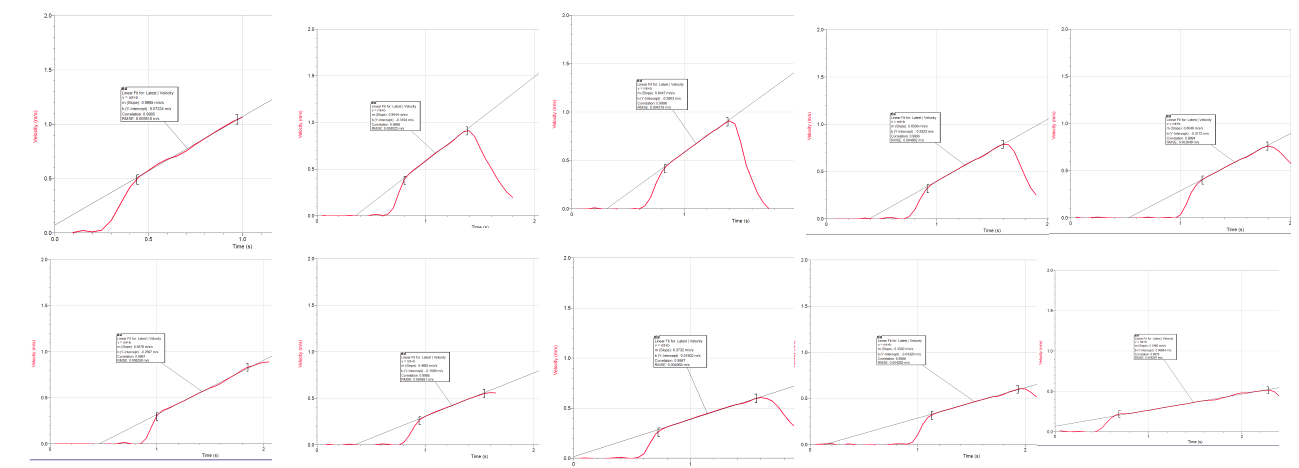 Processed Raw Data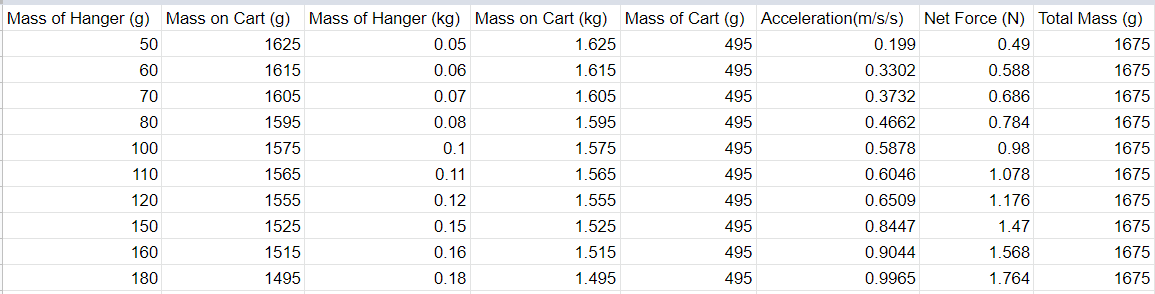 Graph
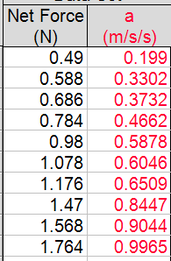
Conclusion: For this research question, we tested how the acceleration of the cart would change in response to a change in net force. To do so, we used a constant amount of mass and changed where the mass was placed: the cart or the hanger. We collected 10 data points, each done in only one trial. We used a motion detector to collect the points for each graph of acceleration of the cart because it was more time efficient and accurate than doing so by hand. The net force to acceleration graph was a proportional linear fit. This means that the y-intercept was 0, which tells us that when there is no net force, there is no acceleration. The graph being linear tells us that the acceleration increases at a constant rate with respect to the net force. The positive slope shown in the graph show a trend in which the acceleration changes at a higher rate as the net force increases. Thus, as net force increases, acceleration increases. Experiment 2Research Question: How is the acceleration of an object affected by the mass of it? Variables:
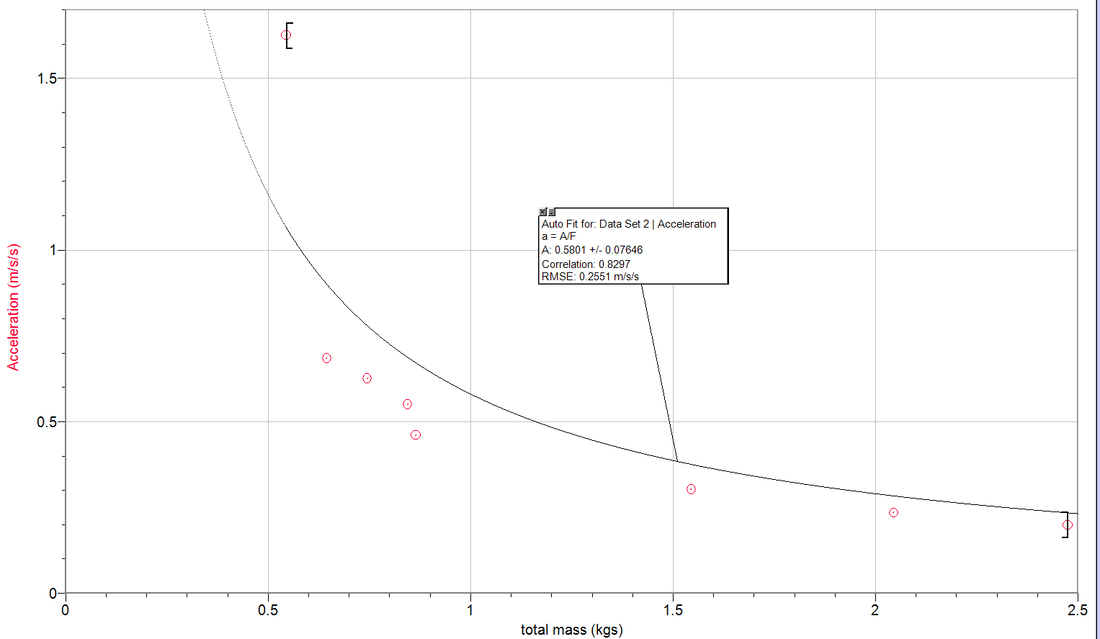
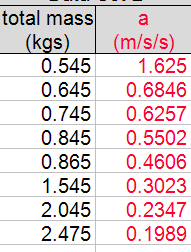
Recorded Raw DataFrom left to right, the mass on the cart is increasing. 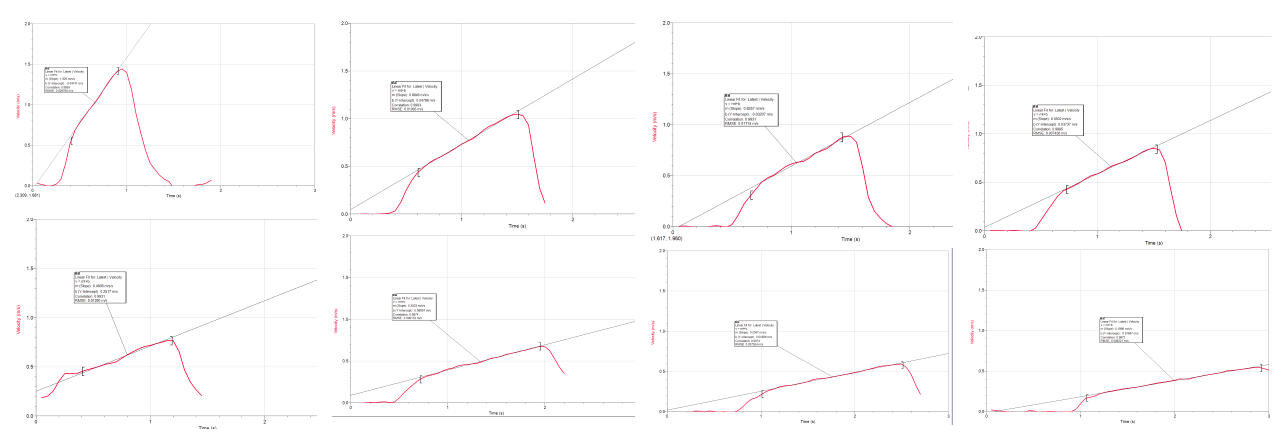 Processed Raw Data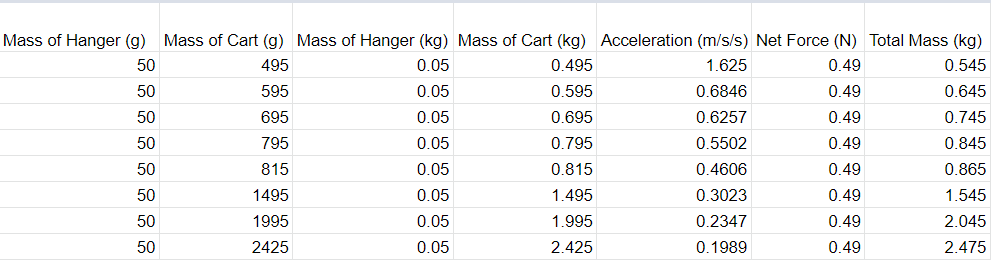 Graph
Conclusion: For this research question, we examined how the total mass of the cart would affect its acceleration. We collected 8 data points of different mass for our mass-acceleration graph. To see the correlation, we added more weights to the cart for each trial to see how the added mass would change the movement of the cart. For each mass, we did one trial. We used the motion sensor to graph the movement or acceleration of the cart. The graph of best fit, chosen to represent the correlation of the total mass and the acceleration of the object, was an inverse function. As seen above, the data points and the graph do not match up that well; however, the graph does a pretty good job at identifying a future trend if more weight were to be added. This fit is not linear because the relationship between mass and acceleration is not a constant change. This graph shows that as the mass increases, the acceleration decreasingly decreases. For Both Experiments: Weaknesses/Uncertainties:
A weakness or uncertainty is that we collected only 8-10 different data points for the amount of net force. Having 10 points seems to be the minimum requirement, so we could have had a more accurate net force-acceleration graph and mass-acceleration graph if we had more points. Improvement: One thing I would do to improve our experiment is to have more time overall to do it. Because we had less time to collect data, we had less points for our graph, thus decreasing our confidence.
0 Comments
|
Archives
December 2021
Categories |

 RSS Feed
